
Page 66 - Demo
P. 66
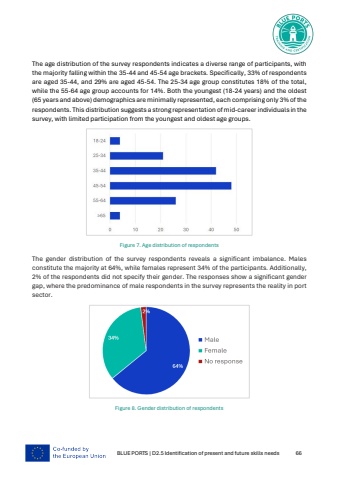
BLUE PORTS | D2.5 Identification of present and future skills needs 66The age distribution of the survey respondents indicates a diverse range of participants, with the majority falling within the 35-44 and 45-54 age brackets. Specifically, 33% of respondents are aged 35-44, and 29% are aged 45-54. The 25-34 age group constitutes 18% of the total, while the 55-64 age group accounts for 14%. Both the youngest (18-24 years) and the oldest (65 years and above) demographics are minimally represented, each comprising only 3% of the respondents. This distribution suggests a strong representation of mid-career individuals in the survey, with limited participation from the youngest and oldest age groups.Figure 7. Age distribution of respondentsThe gender distribution of the survey respondents reveals a significant imbalance. Males constitute the majority at 64%, while females represent 34% of the participants. Additionally, 2% of the respondents did not specify their gender. The responses show a significant gender gap, where the predominance of male respondents in the survey represents the reality in port sector. Figure 8. Gender distribution of respondents
